8. GridPath User Interface
The GridPath user interface (UI) makes it possible to interact with the platform without relying on the command line. A new version of th the UI is under development and will be released in 2026.
8.2. Settings
Using the UI requires that several settings be specified. To do so, open the
UI and go to the Settings screen (top right corner of the navigation
bar). You will see two tables, one for UI Settings and another one for
Solvers.
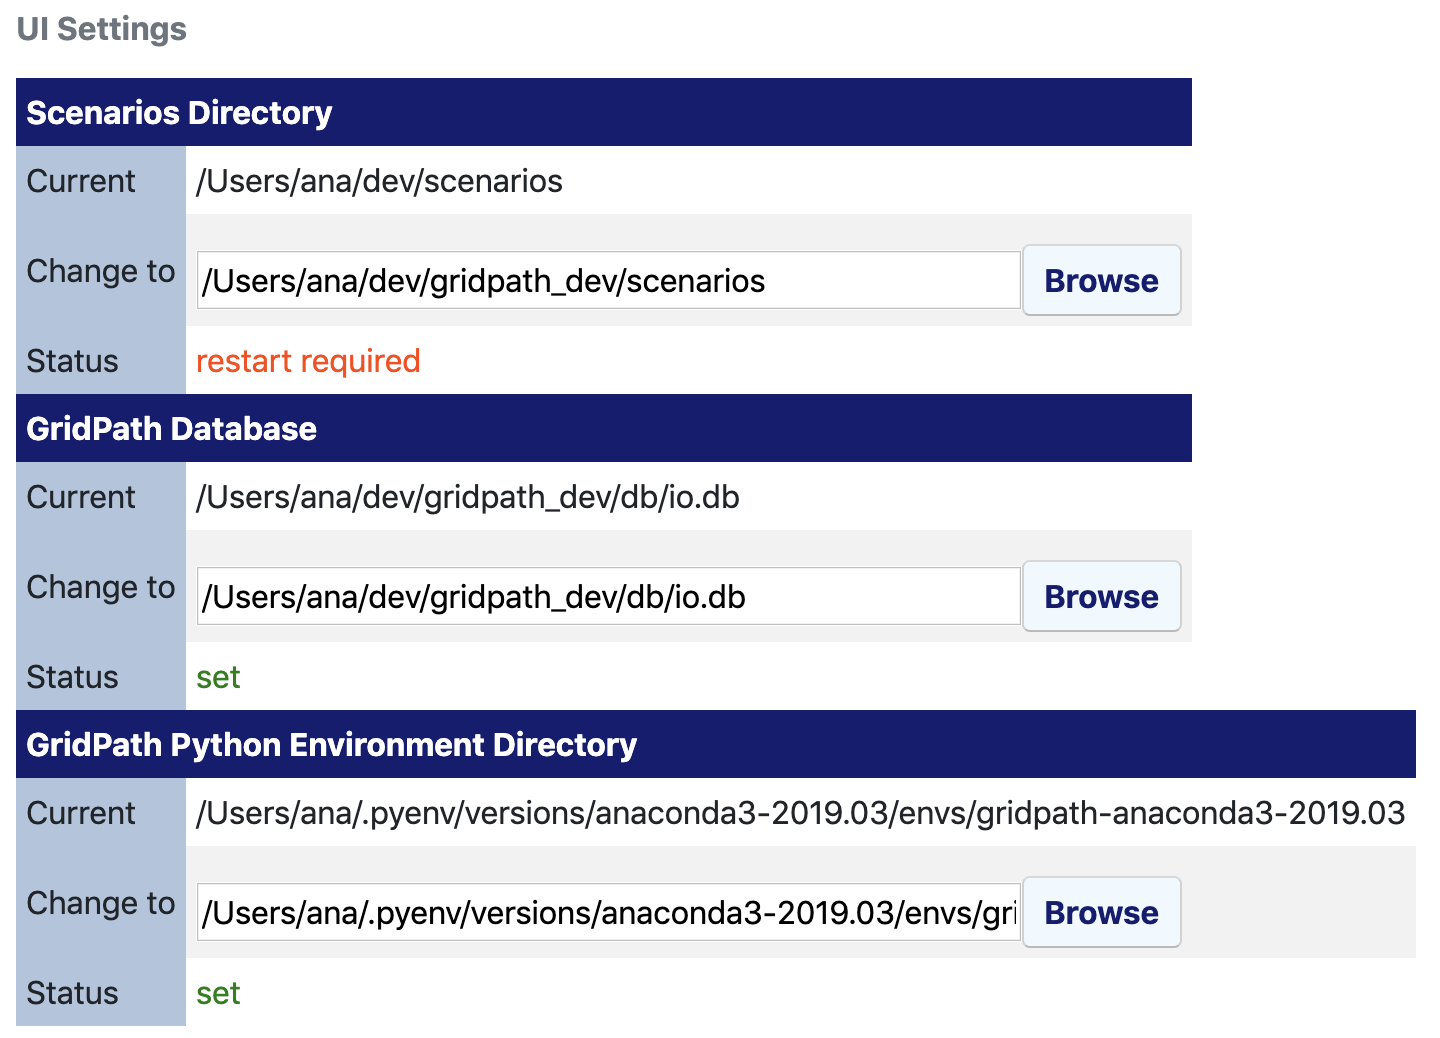
In the UI Settings table, you must specify the directory where
scenarios will be written, the GridPath database file to use, and the
directory of your GridPath Python environment. In the Solvers table,
you must specify up to three different solvers and the location of the
solver executables that the UI can then use to solve scenarios.
8.2.1. UI Settings
Scenarios
Directory
The Scenarios Directory can be any folder in your file system. To
select one click the Browse button in the ‘Change to’ row of the
Scenarios Directory table and select a folder. For the changes to
take effect, you will need to restart the UI. The ‘Status’ row will warn you
if this is the case (it will show ‘not set’ if you haven’t selected a
scenarios directory yet, ‘restart required’ if you need to restart for the
selected directory to be recognized by the UI, or ‘set’ if a directory has
been selected and no further action is required.
GridPath Database
The GridPath UI uses a GridPath database file to manage inputs and outputs.
This database must conform to the GridPath database schema and be
pre-populated with input data. You can then use the UI to create and run
scenarios, and to view results. You must select the database file to use in
the Settings screen by clicking the Browse button in the
‘Change to’ row of the GridPath table and selecting the database file
to use. For any changes to take effect, you will need to restart the UI. The
‘Status’ row will warn you if this is the case (it will show ‘not set’ if
you haven’t selected a database file yet, ‘restart required’ if you
need to restart for the selected database file to be recognize by the UI, or
‘set’ if a database file has been selected and no further action is required.
GridPath Python Environment Directory
The GridPath UI uses your GridPath Python installation. Before using it, you
must install GridPath using the instructions in
Installation. In particular, you must point the UI to
your GridPath Python environment directory PATH/TO/PYTHON/ENV (see
Python Virtual Environment). To select the directory click the
Browse button in the ‘Change to’ row of the Scenarios
Directory table and select the Python environment folder. For the changes to
take effect, you will need to restart the UI. The ‘Status’ row will warn you
if this is the case (it will show ‘not set’ if you haven’t selected
an environment directory yet, ‘restart required’ if you need to restart for the
selected directory to be recognized by the UI, or ‘set’ if a directory has
been selected and no further action is required.
Note
The GridPath UI server will not work until the Python environment directory has been selected and the UI restarted.
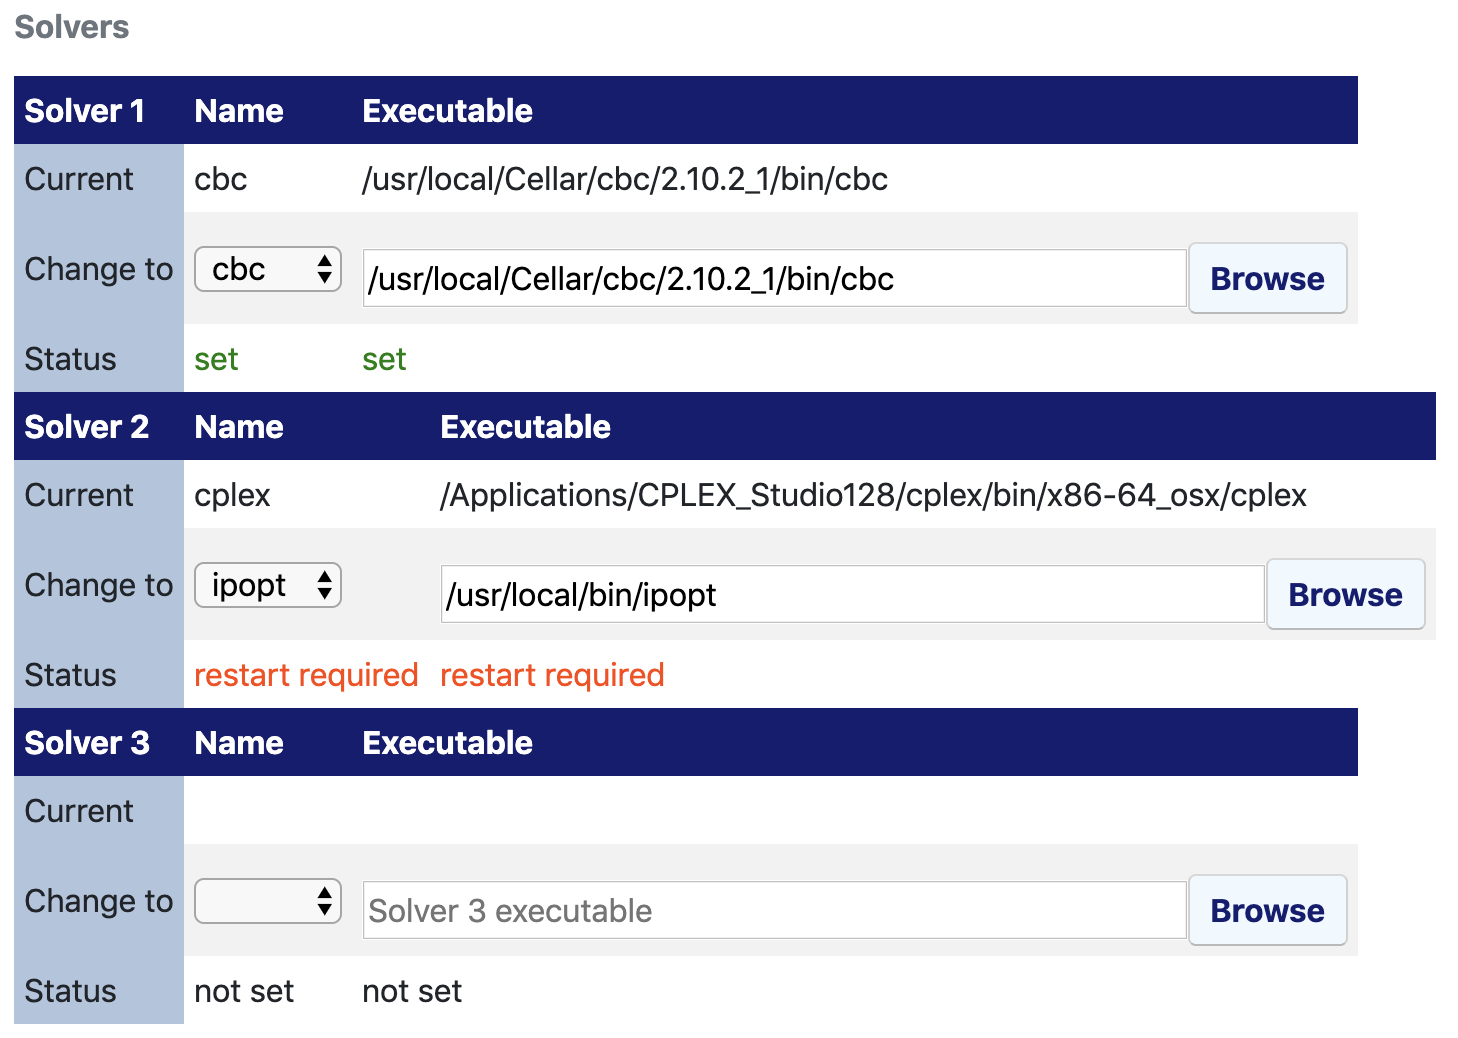
8.2.2. Solvers
You must tell the GridPath UI where the executables are located for solvers
that you want to use to solve scenarios. You can have the UI use up to three
different solvers at a time. Select a solver name from the drop-down menu in
the ‘Change to’ row for one of the three solvers and then find the
executable for that solver using the Browse button in the respective
row. The ‘Status’ row will warn you if a restart is required for either the
solver name or executable value to take effect.
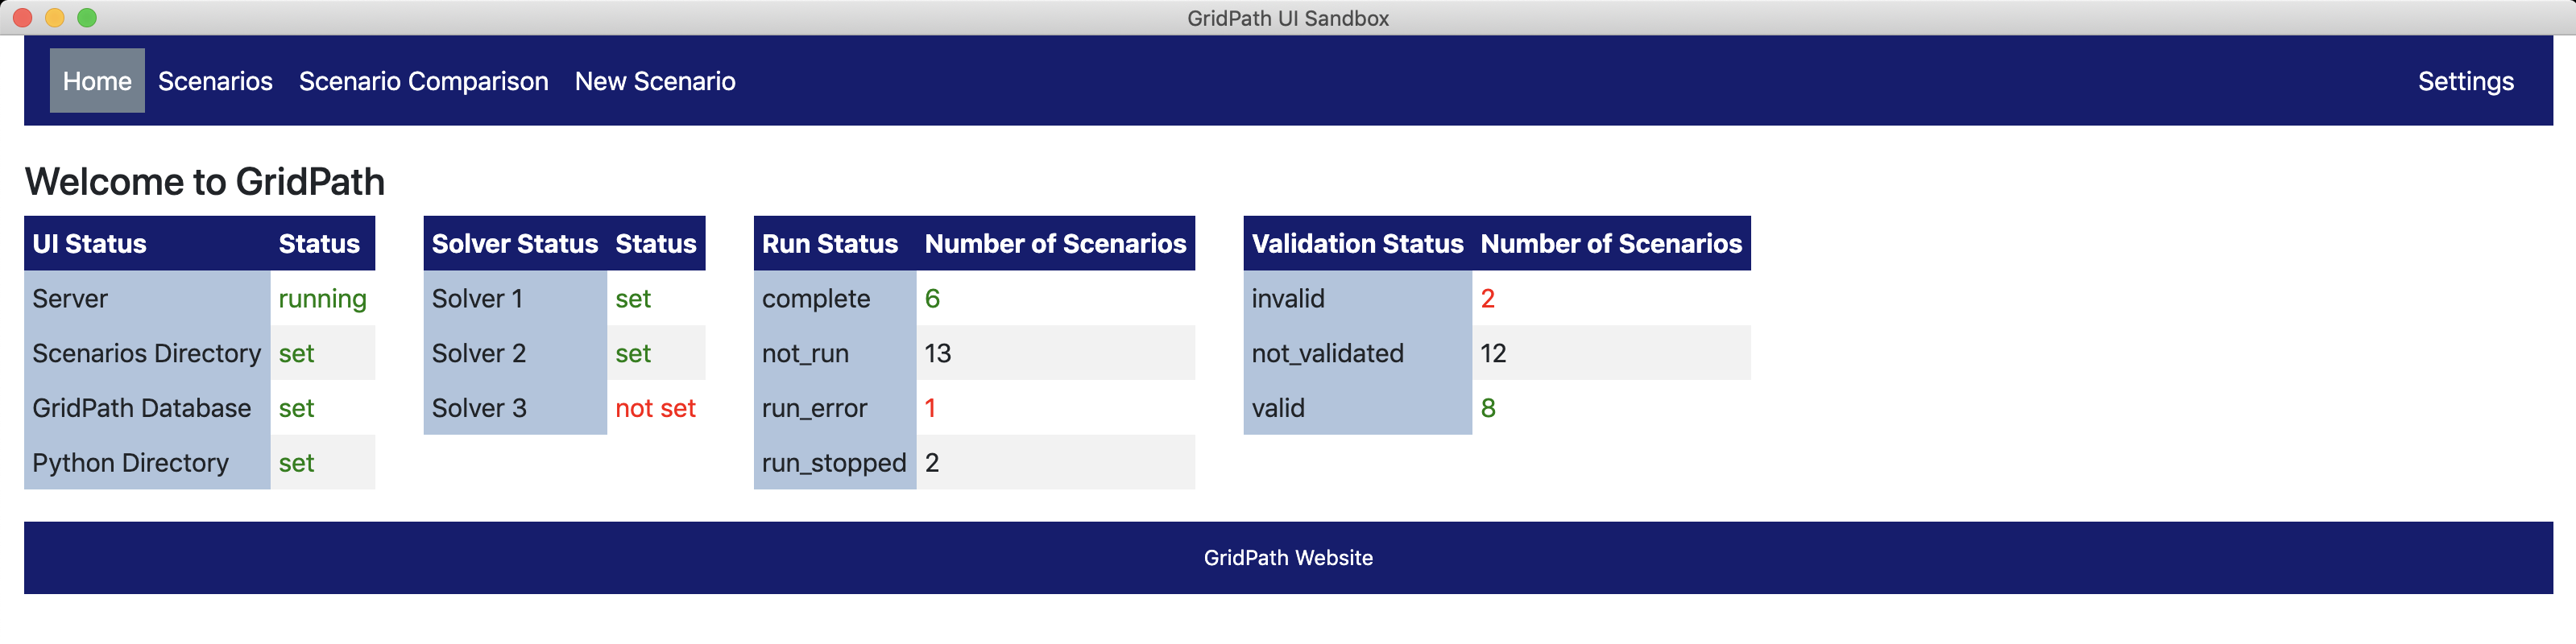
8.3. Home
The GridPath UI Home screen provides an overview of UI settings status
and the scenario status via four different tables.
The UI Status table provides information about whether the UI server
is running and whether the scenarios directory, GridPath database, and
GridPath Python environment directory have been set (see
UI Settings).
The Solver Status table provides information about whether the user
has selected solvers and their respective executables (see
Solvers).
The Run Status table provides information about whether the user’s
GridPath’s scenarios have been run and are complete, and if any have
encountered errors.
The Validation Status table provides information about whether the
user’s GridPath’s scenarios have been validated, and, if so, whether any
have been found to be invalid.
8.4. Scenarios
The GridPath UI Scenarios screen provides a list of all scenarios the
user has created along with their status (validation status and run status)
and options to navigate to viewing detailed scenario information (see
Scenario Detail) via the View Detail button
and, if the scenario is complete, to viewing the scenario results (see
Scenario Results) via the View Results button.
The View Results button is available only if the scenario ‘Run
Status’ is ‘complete.’ The information in the status columns is color-coded
depending on the value. You can navigate to the New Scenario screen
by clicking on the New Scenario button at the top of the scenarios
list (in addition to via the navigation bar).
8.4.1. Scenario Detail
The Scenario Detail screen is accessed from the main Scenario
Screen and is a gateway to more detailed information
about a scenario, including its setup, inputs, status, and results. At the top
of this screen, you can find buttons for deleting a scenario or editing its
setup (i.e. its features and subscenario selections).
The Scenario Status table shows the validation and run status for
the scenario. The table includes columns for the current status and for the
associated action and status detail, i.e. the action to take and detail to
view vary depending on the current status.
Below the Scenario Status table are various tables that include
information about the scenario setup including its features and subscenarios
(grouped by theme/feature) as well as the solver settings to use to run the
scenario.
Deleting a Scenario
Deleting the scenario will currently remove it from the scenarios list and clear all results associated with it in the database; it does not currently delete the scenario directory on disk (but that’s likely what we will do in the future).
Editing a Scenario
Editing the scenario allows the user to change its setup but not its name. Note that editing an existing scenario will remove prior results from the database (but not yet from disk). On the wishlist to implement ASAP is the ability to edit the scenario name and description (without having to delete prior results). We will likely do that via a separate button next to the scenario name/description.
Validating a Scenario
GridPath includes functionality to test the validity of a scenario’s setup
and inputs. Click the Validate Scenario button in the
Validation Status row of the Scenario Status table to
validate or re-validate the scenario. If errors are found, you will be able
to click on a View Errors button in the Detail column to see
a table with the validation errors.
Running a Scenario
If a scenario is not yet ‘complete,’ you will be able to run it by clicking the
Run Scenario button in the Run Status row of the
Scenario Status table. The scenario status should then change to
‘launching’ and then ‘running.’ Once the scenario is running, you will be
able to stop the run via the Stop Run button in the Action
column and to view the scenario log via the View Log button in the
Detail column.
Viewing Scenario Results
If the scenario status in the Scenario Status is ‘complete,’ you
will be able to click on a View Results button in the Detail
column to switch to the scenario results screen. See
Scenario Results.
Clearing a Scenario
If the scenario status in the Scenario Status is ‘complete,’ you
will be able to click on a Clear Results button in the Action
column to clear all scenario results, including validation information.
Scenario Run Solver Info
The Solver Options table below the Scenario Status table
contains information about which solver will be used to run the scenario and
what solver options will be requested.
Viewing Scenario Setup and Inputs
The Features table below the Solver Options table contains
information about which GridPath features are requested by the scenario. The
various tables below (e.g. Temporal Settings, Load Zone
Settings, System Load, Generation and Storage Capacity, and
so on, contain information about the data inputs used by the scenario. Each
row of these tables has the name of the subscenario used in the
Value column. You can see the description of the subscenario and the
underlying data by clicking on the row’s View Description and View
Inputs buttons respectively.
8.4.2. Scenario Results
The Scenario Results view can be accessed if a scenario is
‘complete’ by clicking on the View Results button in either the main
Scenarios view or the Scenario Detail view.
This view includes a row for results tables and a row for results plots that can be viewed in the UI.
You can click on the Show Table or Show Plot buttons to view
the table or plot, and on the Download Data button to download the
underlying data to a CSV file. For the plots, you will usually also use the
dropdown menus to slice out a particular set of data (e.g. the new capacity
built in a certain zone or the operations for a particular generator in a
particular period and/or stage). You can also set the size of the y-axis by
using the Ymax (MW) input field.
Tables will be shown separately. You can add any number of plots to the view. Clear them with the code:Clear Plots button at the beginning of the plots row.
Plots are interactive. You can hover to view detail on the underlying data, pan, and zoom in and out. You can also download the plot image via the disk icon. You can hide individual plot items by clicking on the respective legend label. The whole legend can be hidden by double-clicking on the right side of the plot where the legend is located.
8.5. Scenarios Comparison
The GridPath UI Scenarios Comparison screen provides functionality
to compare the setup/inputs and results for an arbitrary number of scenarios.
8.5.1. Scenario Selection
The main Scenarios Comparison screen is where the user must choose a
‘Base’ scenario (select one scenario in the Choose Base Scenario
column of the Scenario Selection table) and any number of scenarios
to compare to the ‘base’ scenario (select any number of scenarios in the
Select Scenarios to Compare column of the Scenario Selection
table). You can then click on either the Compare Inputs or the
Compare Results directory to view a comparison of the inputs and
results of the selected scenarios respectively.
8.5.2. Comparing Scenario Inputs
When comparing scenario inputs, you will see the same tables as in the
Scenario Detail screen (see Scenario Detail)
but including all the scenarios selected in the scenario-selection screen.
In each table, the ‘Base’ scenario you selected will be on the left,
followed by columns for each of the selected scenarios to compare. In each
table for each scenario to compare, differences from the ‘Base’ scenario
will be highlighted.
8.5.3. Comparing Scenario Results
When comparing scenario results, you will see the same view as in the
Scenario Results screen (see Scenario Results)
containing a row for results tables and a row for results plots available to
view in the UI. These tables, however, will contain the results for all
scenarios selected; results for the ‘Base’ scenario will be listed first,
followed by those for the scenarios to compare. Similarly, clicking on a
Show Plots button will display the plots for each of the scenarios
selected, with that for the ‘Base’ scenario at the top. Note that the
available options in the drop-down menus of the plot will depend on the
‘Base’ scenario (e.g. if you select a scenario with a single load zone as
the ‘Base’ scenario but are comparing to a scenario with two load zones,
only the ‘Base’ scenario load zone will be available in the Select
Zone drop-down menu).
8.6. New Scenario
The GridPath UI New Scenario screen makes it possible to create a
new scenario via the UI. This view looks similar to the Scenario
Detail screen (see Scenario Detail) but the user must
populate the values in the various scenario-detail tables. You can
pre-populate all fields based on an existing scenario by selecting a
scenario name and clicking the Populate from Scenario button, the
adding a name and description for the new scenario, and changing any inputs
from the pre-populated values.
Note
New scenario names cannot have white spaces at this stage.